Table of Contents |
guest 2025-05-15 |
Analysis Workflow
Consensus Clustering
Disease Transcriptomic Profiles
Analysis Options
Files
Analysis Overview
Analysis Workflow
The SSF molecular taxonomy project seeks to perform a comparative analysis of skin diseases leading to the determination of disease specific gene signatures that can be used in predictive modeling. We began by determining publicly available experiments that would be suitable for an integrated analysis. The final analysis was performed on 8 microarray datasets evaluating human skin biopsies. The derived data was then normalized to bring the data into a comparable data range. Next the data was merged on shared genes resulting in 14,673 genes from 478 disease and 366 control samples. Differential expression was performed using the disease only samples comparing each disease to the rest in binary comparisons using LIMMA. The results of this analysis are available in the "Volcano Plot" module. Preliminary disease signatures were determined by taking the positive only genes from the DE lists, ranking by adjusted p-value and taking the unique top ~100 genes (some diseases had less then 100 genes). These signatures are available in the "Heat Map" module.
Consensus Clustering

Figure 1: Consensus clusters of integrated microarray data for 9 different skin diseases from 8 different experiments produced by SC3. The heatmap represents the frequency of a cell clustering with a given cell across a permutation of cluster solutions where the diagonal gives the frequency of a cell clustering with itself. The controls represent healthy and non-lesional biopsies across all experiments.
Disease Transcriptomic Profiles
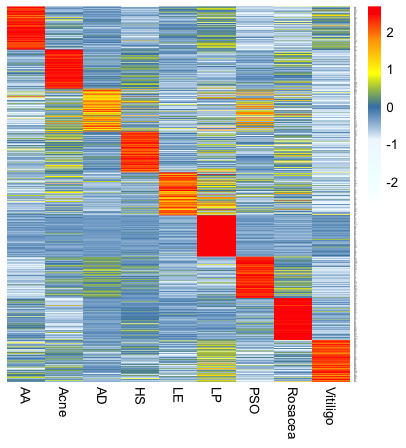
Figure 2: Top 100 unique differentially expressed genes for each disease type. List of genes provided below.
Analysis Options


